
Last month, I had dinner with a long-term friend who is now part of a team that sets strategic technical plans for his E&P employer. Setting strategies requires a standardized view of technical & financial data across all assets, in this case, multinational assets around the world. This data is required at both granular and helicopter level. One of the things he mentioned was “I have to start by fixing data standards. I am surprised how little progress data-management standards have made since the POSC days in the mid 90s.”
How did Data Management evolve in oil & gas? Are we repeating mistakes? Are we making any progress? Here is what my oil and gas friends and I remember in this first part of a three-part series. Please join me on this journey down memory lane and add your own thoughts.
The 1960s & 70s
Perhaps we can call these times, mainframe times. Mainframes started to make their way into our industry around the mid-60s. At that time, they were mostly used to maintain accounting data. Like most data at this time, E&P accounting data was manually entered into systems, and companies employed large data-entry staff to input. Any computational requirement of the data was through feeding programs through “punch cards”.
Wireline logs (together with Seismic data) were one of the very first technical data that required the use of computers, mainly at the service provider’s Computer Centers and then at the large offices of the largest major operators. A friend of mine at Schlumberger remembers the first log data processing center in Houston opening about 1970. In the mid-70’s more oil city offices (Midland, Oklahoma City, etc.) established regional computing centers. Here, wireline log data, including petrophysical and geological processing, was “translated” from films into paper log graphics for clients.
A geophysicist friend remembers using mainframe computers to read seismic tapes in the mid-70s. He said, “Everything was scheduled. I would submit my job, consisting of data and many Punch Cards, into boxes to get the output I needed to start my interpretation. That output could be anything from big roll of papers for seismic sections to an assemblage of data that could then be plotted. Jobs that took 4 hours to process on a mainframe in the 70’s are instantaneous today”
The Society of Exploration Geophysicist (SEG) introduced and published data formatting standard SEG_Y in 1975. SEG-Y formats are still utilized today.
The need to use a standard, well number identification process became apparent as early as 1956. Regulatory agencies started assigning API numbers to wells in the late 60s in the USA. The concept of developing world wide global well ID numbers is still being discussed today with some organizations making good progress.
The 2nd half of the 70s, pocket calculators and mini computers made their way to the industry. With that some computations could be done at the office or on the logging truck at the field without the need for Mainframes.
The 1980s
Early 80s. With the proven success of 3D seismic introduced by ExxonMobil, large and special projects started heavily processing 3D seismic on Mainframes. However, the majority of technical data was still mainly on paper. Wireline logs were still printed on paper for petrophysicists to add their handwritten interpretations. Subsurface maps were still drawn, contoured and colored by hand. Engineering data came in from the field on paper and was then recorded on a running paper table. A reservoir engineer remembers “We hired data clerks to read field paper forms and write the data in table (also on paper)”.
As personal computers (PCs) made their way into the industry, some large companies started experimenting, albeit they lacked the personal side since PCs were numbered and located in a common area. Employees were only given occasional access to them. These were also standalone computers, not networked. Data transfer from one PC to another happened via floppy disk. It was during this time that engineers were first exposed to spreadsheets (boy did they love those spreadsheets! I know I do)
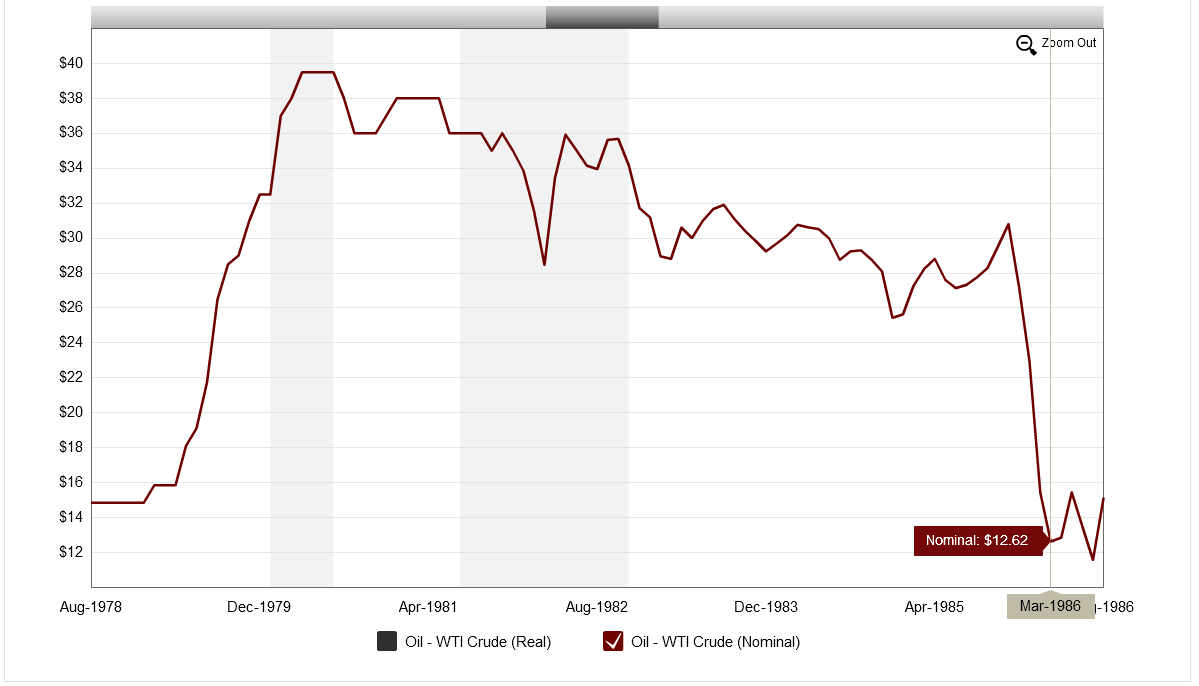
Mid-80s. March 1986, oil prices crashed, a 55% drop over few days. In the three years following the crash, the industry shed staff the way cats shed hair. The number of petroleum staff dropped from approximately 1,000,000 employed staff to approximately 500,000 in three years.
Late 80s. But what seemed bad for the industry, may have also done the industry a favor. The oil price crash may have actually accelerated the adoption of technology. With a lot less staff, companies were looking for ways to accomplish more with less staff.
A geologist friend remembers using Zmap as early as 1988, which was the beginning of the move towards predominantly computer-based maps and technical data.
For data nerds:
- Engineers and geo professionals were responsible for maintaining their own data in their offices.
- Although not very formal, copies of the data were maintained in centralized “physical” libraries. Data was very important in the “heat of the moment” after the project is complete, that data is someone else’s issue. Except there was no “someone else” yet.
- This system produced many, many versions of the same data (or a little variation of it) all over. This data was predominantly kept on physical media and some kept on floppy disks which were mostly maintained by individuals.
- From the 60s through to the end of the 80s, we can say there were mostly two global standards, one for the seismic data formatting – SEG-Y – and the other for log data – LAS (Log Ascii Standard). Any other standards were country- or company-specific.
I would love to hear from you if you feel I have missed anything or if you can add to our knowledge of how technical E&P data was managed during the above period.
Stay tuned for the 90s …
